Housing, Affordability, and Long-Term Neighborhood Belonging
-
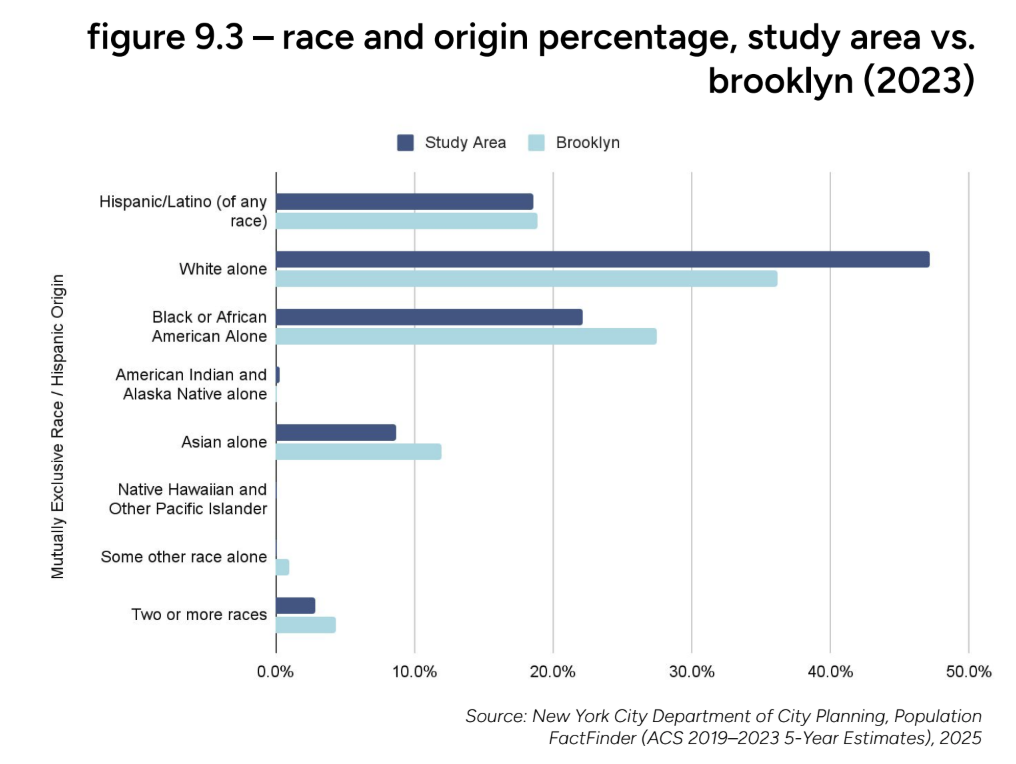
The 2009 Coney Island rezoning set initial expectations for approximately 2,400 new residential units, including 600 affordable units, signaling a vision of measured growth and balanced neighborhood reinvestment. However, by 2016, approximately 3,400 housing units had already been completed — exceeding original projections and reflecting a faster-than-anticipated pace of development. This divergence between projected and actual growth underscores the need for ongoing monitoring of land use change, housing production, and affordability outcomes to ensure that development aligns with community needs and long-term neighborhood stability.
-
Median Home Value in Coney Island: $432,149; Brooklyn: $865,300
Median Gross Rent in Coney Island: $985; Brooklyn: $1,715; NYC: $1,714
Housing Vacancy in Coney Island: 6.6%; Brooklyn: 7.6%; NYC: 9.3%
-
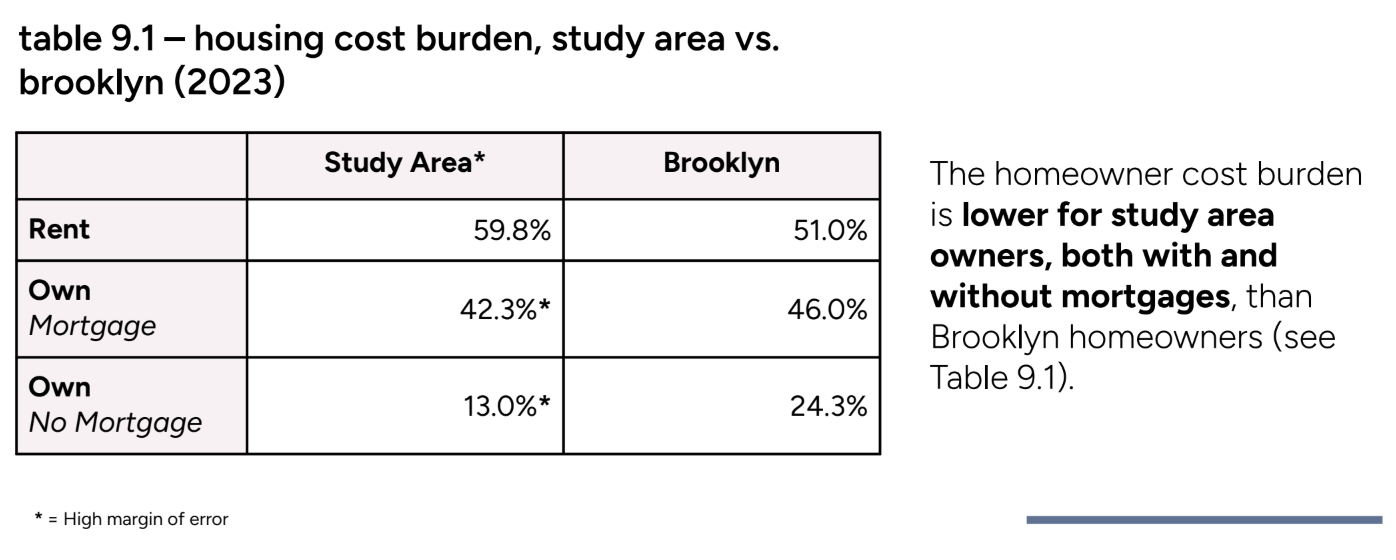
Despite high levels of renter occupancy — with approximately 73% of residents renting compared to 69% in Brooklyn and 67% citywide — affordability pressures remain significant. Approximately 58% of renters in Coney Island are rent burdened, exceeding both Brooklyn and citywide averages.
While Mandatory Inclusionary Housing (MIH) policies have the potential to ensure 20–30% permanently affordable units in new developments, implementation in Coney Island has remained limited and inconsistently applied, with affordability commitments not comprehensively mapped across recent projects. This policy gap highlights a critical challenge in ensuring that new development translates into sustained housing affordability for existing residents.
-
53% reported that “Housing is not affordable”
61% agreed that Coney Island needs more affordable housing
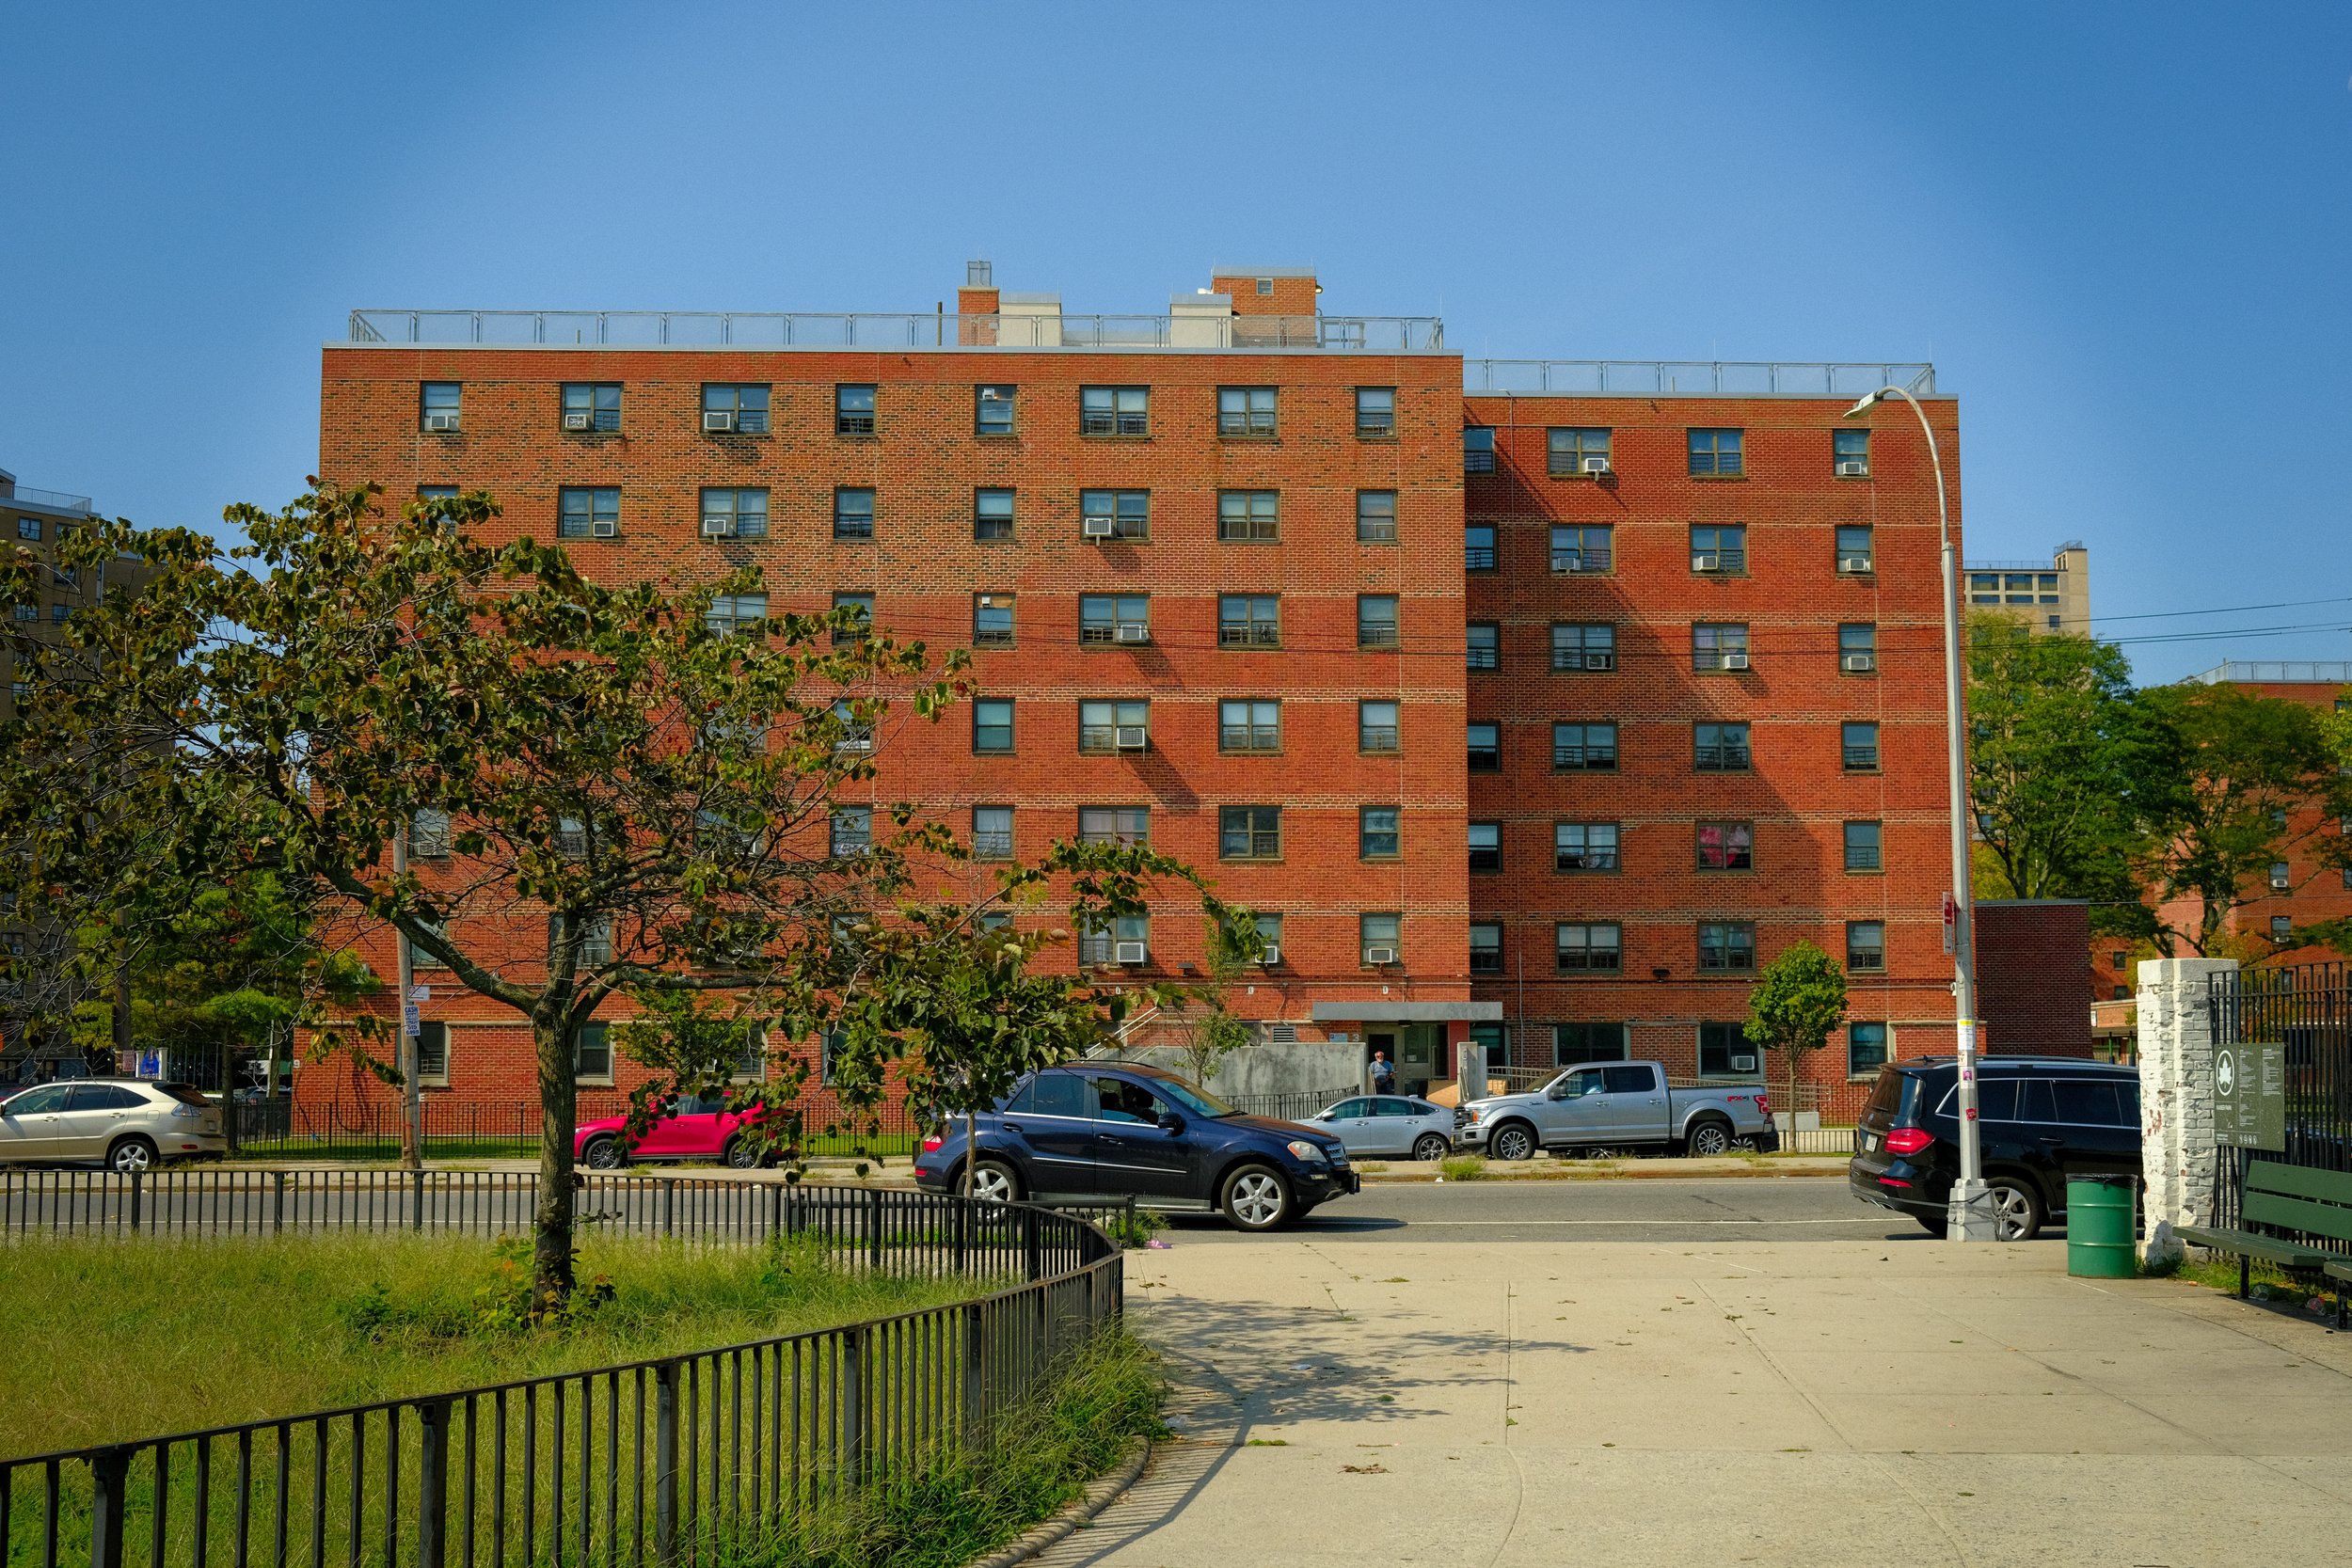
71% reported that Housing is not well-maintained, comfortable, or safe
71% disagree with development of market-rate/luxury housing (55% strongly disagree)
63% agree that There aren’t programs to help if at risk of losing housing
40% reported that Purchasing a home does not feel attainable
-
Affordable housing (rent and own) (12)
Middle income
Maintenance & Cleanliness (9)
Safety (8)
More police for public housing
Housing Conditions
No new developments (2)
Larger units (lack of 3-br)
More units
Increasing ownership
Luxury apartments with preference for those already living in the area
Community Insights on Housing
-

"The elevators break down all the time. Every week, we have no elevators."
- Rebecca Greenberg, NY1 Resident
-

“I was in the process of starting a garden that'd make it a community garden inside public housing and teach the fact that it would be healthier (for residents).”
- Anne Valdez, Community Member & Organizer
-
“That would be a start, retrofitting all the developments and the private houses to be more sustainable should water come up.”
- Anne Valdez, Community Member & Organizer
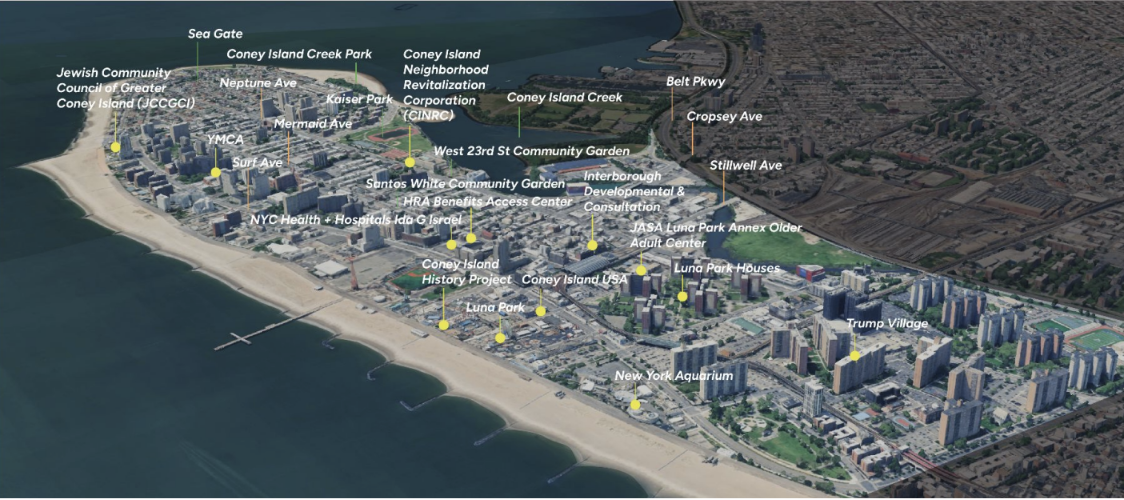
The People who Live and Work in Coney Island
Spotlight on Housing Affordability
-
![]()
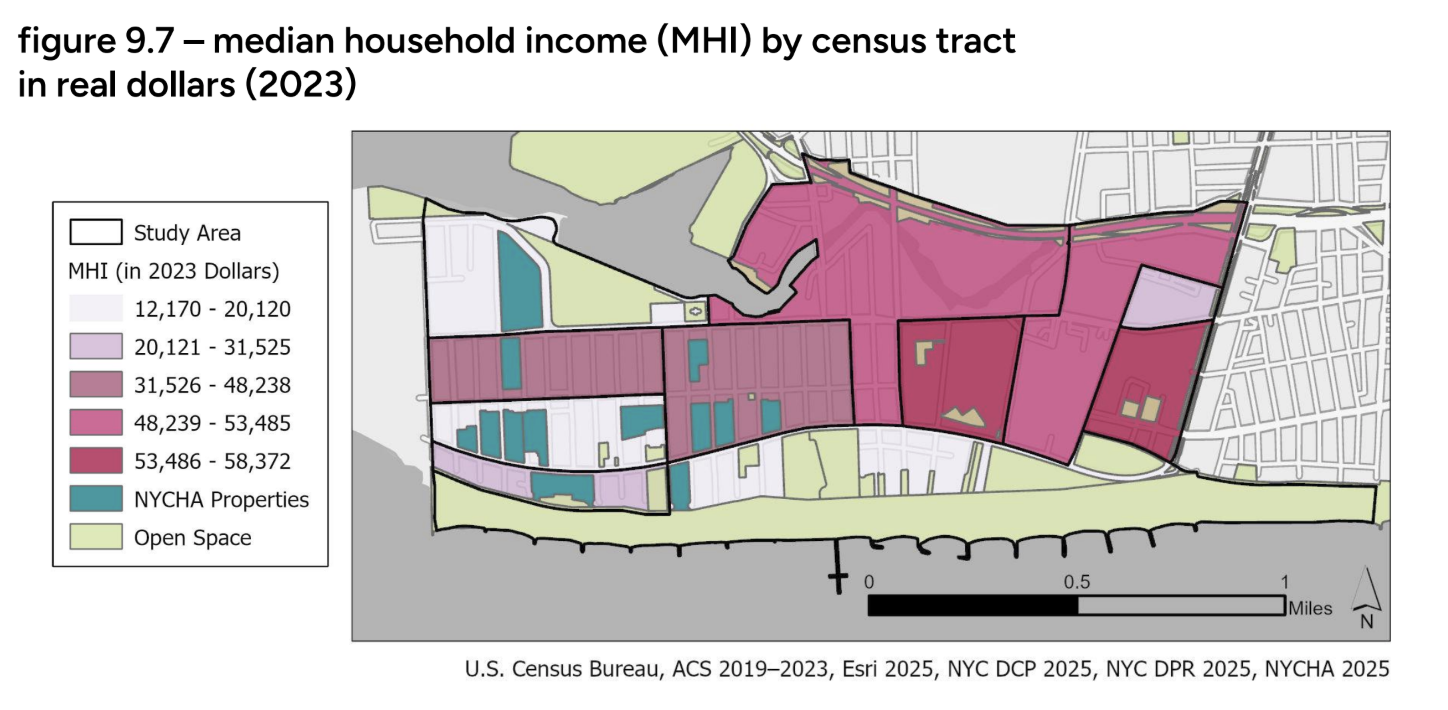
Median Household Income by Census Tract
33.6% of households have an income of less than $20,000 per year in Coney Island, compared to 16.5% in BK and 16.3% in NYC goes here
-
![]()
Percent of Persons Living Below Poverty Level
Approximately 29.5% of residents live below the poverty line, compared to 19% across Brooklyn. Among older adults ages 75–84, 4.4% of Coney Island residents fall below the poverty line, compared to just 0.9% borough-wide. Gender disparities are also evident, with 17.4% of women in Coney Island living in poverty, compared to 9.6% across New York City.
-
![]()
Renters as a Percent of all Households by Census Tract
Coney Island is approximately 73% renter-occupied, compared to 69% in Brooklyn and 67% across New York City, indicating a higher reliance on rental housing than both the borough and the city as a whole.
-
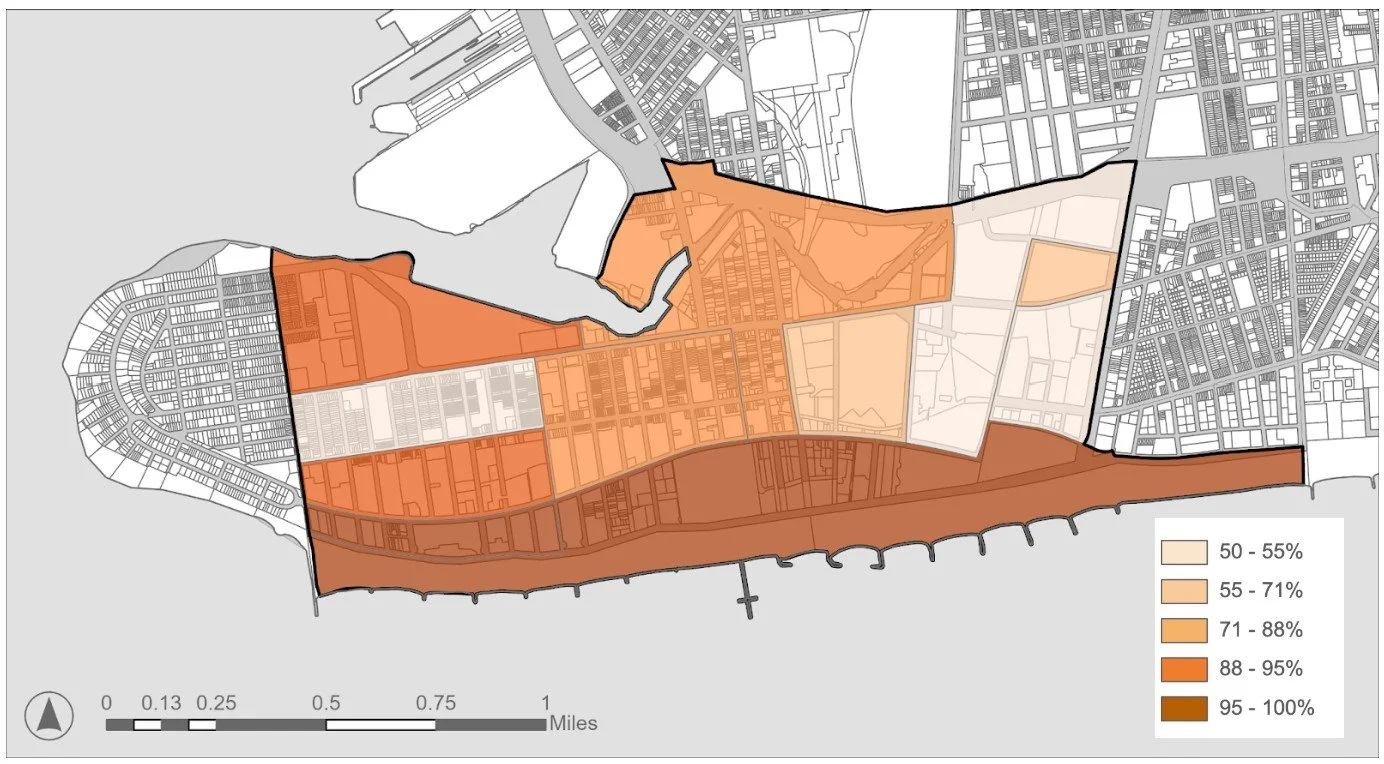
![]()
Rent Burdened Households by Census Tract (Paying 30% or more of income)
58% of renters are rent burdened (>30%) in Coney Island compared to 49% in Brooklyn and NYC, as illustrated in the map below. Several thousand renting households are severely rent burdened, spending at least half of their total household income on housing related costs.
-
![]()
Total Number of Renting Households Experiencing a Severe Housing Burden (50% or more of income)
A significant share of renting households in Coney Island experience a severe housing burden, spending 50% or more of their income on rent, reflecting ongoing affordability challenges and financial strain among residents.


Empower Local Housing Rights Education & Community Ownership Systems
This set of recommendations focused on strengthening housing stability through education, transparency, and collective empowerment. Rather than relying solely on external regulatory mechanisms, these strategies prioritize equipping existing renters and homeowners with accessible tools, shared resources, and clear pathways for understanding their rights and navigating local housing systems. Across engagement efforts, residents consistently emphasized the need for more direct access to information and stronger mechanisms for collective advocacy in the face of ongoing housing pressure and neighborhood change.
Together, these recommendations position housing not only as an individual concern, but as a collective infrastructure system that can be strengthened through shared knowledge, transparency, and cooperative action. The full report expands on these strategies within the broader context of community-led planning and long-term neighborhood resilience in Coney Island.
-
A primary recommendation is the development of sustained housing rights education initiatives designed to inform residents of their legal protections, responsibilities, and available support systems. This includes resource-sharing networks that distribute accessible, multilingual, and community-informed materials on tenant protections, rent regulation, eviction prevention, and homeownership support.
By grounding housing knowledge within trusted community spaces, this approach aims to reduce information barriers and strengthen resident capacity to respond to housing challenges proactively.
-
To improve access to timely and relevant housing information, the creation of a Community Dashboard is recommended as a centralized platform for housing-related data, updates, and resources. This tool would provide residents with clear visibility into development activity, housing policy changes, affordability commitments, and local support services.
By consolidating this information in an accessible format, the dashboard would strengthen transparency and support more informed community participation in housing and land use decisions.
-
Residents also expressed interest in cooperative housing models as a long-term strategy for stabilizing housing access and expanding community control over local development. Supporting the formation and education of housing cooperatives offers a pathway toward collective ownership, shared decision-making, and long-term affordability.
This recommendation emphasizes the potential of cooperative structures to shift housing from a speculative asset toward a community-managed resource that prioritizes stability, equity, and neighborhood continuity.